

The S&P 500 (SPY) is starting to test key support levels for the first time since November 2023 given continuing signs that Fed rate cuts are getting pushed further and further into the future. This begs the question of “how low could stocks go?” 44 year investment veteran Steve Reitmeister does his level best to answer that question including a trading plan and top picks to stay one step ahead of the market. Read on below for the full story.
Anyone who knows me personally would question my choice of professions. That is because I highly value rationality and fairness. And yet the stock market that is at the epicenter of my daily activities is highly irrational and unfair.
Over the past 44 years I have come to expect the unexpected which makes it easier to deal with the bouts of volatility and insanity.
That sets us up for an interesting discussion today to talk about what is the reasonable path for the stock market from here. And then what is possible (which might deviate greatly from the reasonable path). And yes, along with that I will share a trading plan to stay on the right side of the action.
Market Commentary
Plain and simple, stock prices got ahead of the fundamentals. High inflation is not yet fully tamed and thus the economic catalyst of lower rates is pushed out further and further into the future.
Now the debate is about whether the first cut is coming in July or September (and maybe even later). Given that rates would still be quite high and restrictive to the economy at that level, then the economic benefit of all this is looking more like a 2025 affair.
That says that stock prices are a bit too richly valued here in 2024 leading to an appropriate round of profit taking. Meaning that the reasonable response is for stocks to retrace some of the recent steps which brings us to the S&P 500 (SPY) chart below.
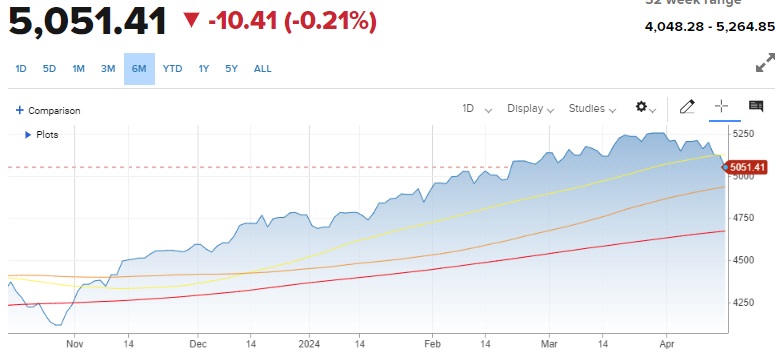
Moving Averages: 50 Day (yellow), 100 Day (orange), 200 Day (red)
We just broke below the 50 day moving average for the first time since early November. This puts the 100 day moving average in sight at 4,921.
However, that level is coming up quite a bit. Soon it would conjoin with the psychologically important 5,000 mark to provide ample support for the market.
Meaning the reasonable and rational move for this market is to give back about 5% from the recent highs of 5,265 to find a low around 5,000.
Unfortunately, as shared in the intro…the market is quite often not rational at all. This means that we do have to consider the possibility of a test of 200 day moving average.
I see virtually no chance we make it all the way down to its current locale at 4,666. However, given that its current slope gets it to around 4,800 by end of May. Then that test is a possibility down the road. Especially with any more bad news on the inflation front which further delays the first rate cut.
Also, on the spectrum of the market not being rationale, this down spell could soon be over with a move back towards the recent highs. That could happen because investors work on the premise of what lies ahead…not what is happening now.
Thus, knowing that rates will be cut at some point, then investors may continue to rev their engines at this red light knowing it will soon turn green.
Meaning that after this modest, and long overdue pullback, some excesses will have been removed allowing investors to patiently play in a trading range between 5,000 and 5,265 awaiting the rate cut signal to press higher.
Trading Plan
This is still very much a bull market. Just one that was a bit overextended and ripe for the pullback that is taking place now.
I see downside risk for the S&P 500 as about 250 points (5%) to 4,800 versus upside to my target of 5,500 by years end (10% upside). The better reward than risk has me continuing to be fully invested at this time. Just a slightly more conservative mix of stocks to weather any coming storm (and yes those moves have already been quite beneficial in April in the midst of this pullback).
Investors should continue to have a greater eye towards value than growth. The 18% loss this year for the growth posterchild, ARK Innovation Fund (ARKK), is a perfect example of what I am talking about avoiding now.
Gladly the 31 factors of value calculated in our exclusive POWR Ratings system will help to insure you have a value bias at this time.
On top of that investors will be very focused on the quality of earnings reports that starting rolling in earnest over the next several weeks.
Companies that beat will be rewarded.
Companies that miss will be crushed.
Gladly the additional 13 factors of Growth and 31 factors of fundamental Quality also in the POWR Ratings is a proven statistical advantage to find companies more likely to beat earnings and enjoy share price outperformance.
Long story short, now is a vital time to be focused on the best POWR Ratings stocks. To see my favorite picks, then read on below…
What To Do Next?
Discover my current portfolio of 12 stocks packed to the brim with the outperforming benefits found in our exclusive POWR Ratings model. (Nearly 4X better than the S&P 500 going back to 1999)
This includes 5 under the radar small caps recently added with tremendous upside potential.
Plus I have 1 special ETF that is incredibly well positioned to outpace the market in the weeks and months ahead.
This is all based on my 44 years of investing experience seeing bull markets…bear markets…and everything between.
If you are curious to learn more, and want to see these lucky 13 hand selected trades, then please click the link below to get started now.
Steve Reitmeister’s Trading Plan & Top Picks >
Wishing you a world of investment success!

Steve Reitmeister…but everyone calls me Reity (pronounced “Righty”)
CEO, StockNews.com and Editor, Reitmeister Total Return
SPY shares were trading at $503.53 per share on Tuesday afternoon, down $0.92 (-0.18%). Year-to-date, SPY has gained 6.27%, versus a % rise in the benchmark S&P 500 index during the same period.
About the Author: Steve Reitmeister

Steve is better known to the StockNews audience as “Reity”. Not only is he the CEO of the firm, but he also shares his 40 years of investment experience in the Reitmeister Total Return portfolio. Learn more about Reity’s background, along with links to his most recent articles and stock picks.
The post How Low Could Stocks Go? appeared first on StockNews.com


